Deep Dive on Attrition
Stuart Miller August 14, 2019
# import libraries
library(knitr)
library(tidyverse)
library(naniar)
library(Hmisc)
library(GGally)
library(gridExtra)
library(RColorBrewer)
library(gplots)
library(corrplot)
library(ggthemes)

# import helper functions
source('../helper/data_munging.R')
source('../helper/visual.R')

# read in data
train <- read_csv('../data/CaseStudy2-data_train.csv')

# create a vector of numeric features
features.numeric <- c('DailyRate', 'DistanceFromHome', 'Age', 'HourlyRate', 'MonthlyIncome', 'MonthlyRate',
           'NumCompaniesWorked','PercentSalaryHike', 'TotalWorkingYears', 'TrainingTimesLastYear',
           'YearsAtCompany','YearsInCurrentRole','YearsSinceLastPromotion', 'YearsWithCurrManager')

# create a vector of numeric features
features.factor <- c('BusinessTravel', 'Department', 'Education', 'EducationField',
                     'EnvironmentSatisfaction', 'Gender', 'JobInvolvement', 'JobLevel',
                     'JobRole', 'JobSatisfaction', 'MaritalStatus', 'OverTime',
                     'PerformanceRating', 'RelationshipSatisfaction', 'StockOptionLevel',
                     'WorkLifeBalance', 'Attrition')

# factor categorical variables
train[, features.factor] <- lapply(train[, features.factor], as.factor)
Analysis of Attrtion
The objective is to find where high attrition is correlated. Based on previous EDA, the following variables (or levels of variables) seem to be associated with attrition. The top 3 factors associated with attrition are numbered. The top 3 factors associated with attrition are examinated in association to other relative factors.
Factor
- JobInvolvement - 1
- WorkLifeBalance - 2
- OverTime - 3
- JobRole
- JobLevel
- JobSatisfaction
Numeric
- MonthlyIncome
- TotalWorkingYears
- YearsInCurrentRole
- YearsWithCurrmanager
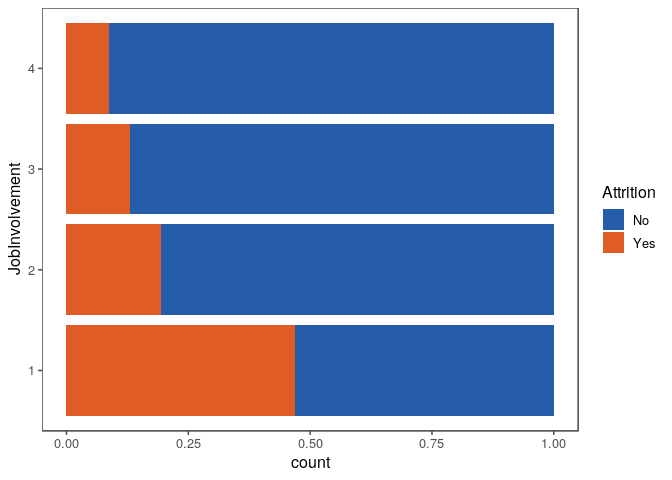
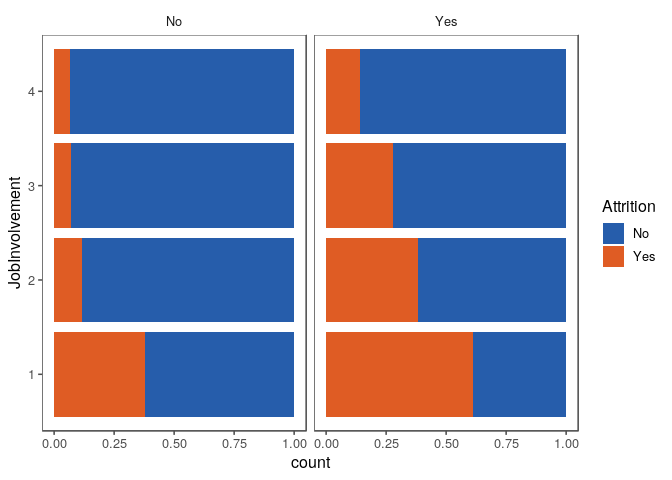
Job Involvement
Job involvement appears to have a high impact on employee attrition.
Nearly 50% with the lowest job involvement leave the position. It is
expected that there would be an interaction with JobRole, JobLevel,
and OverTime.
train %>% ggplot(aes(x = JobInvolvement, fill = Attrition)) +
  geom_bar(position = 'fill') +
  coord_flip() +
  scale_fill_few(palette = 'Dark') +
  theme_few()
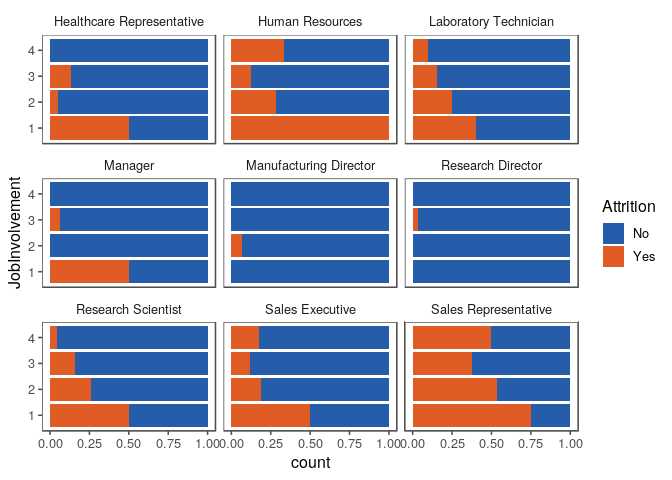
Job Role Interaction
Almost all job roles show high attrition with low job involvement. With Human Resources and Sales Representative having the worst rates. Notibly, attrition rates of Manufacturing Director and Research Director do not seem to be affected by job involvement.
train %>% ggplot(aes(x = JobInvolvement, fill = Attrition)) +
  geom_bar(position = 'fill') +
  coord_flip() +
  facet_wrap( ~ JobRole) +
  scale_fill_few(palette = 'Dark') +
  theme_few()
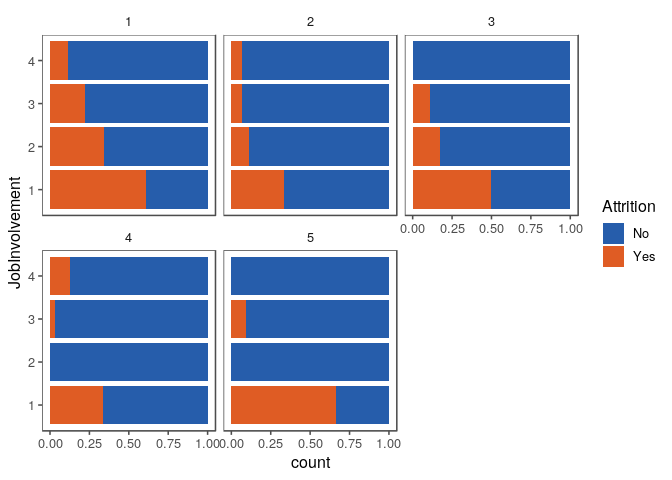
Job Level Interaction
Attriton is high for all job levels where job level is low. It is especially high (over 50%) in level 1 and 5.
train %>% ggplot(aes(x = JobInvolvement, fill = Attrition)) +
  geom_bar(position = 'fill') +
  coord_flip() +
  facet_wrap( ~ JobLevel) +
  scale_fill_few(palette = 'Dark') +
  theme_few()
Overtime Interaction
Attrition is higher for eac level of job involvement, but it is also generally higher for Overtime workers.
train %>% ggplot(aes(x = JobInvolvement, fill = Attrition)) +
  geom_bar(position = 'fill') +
  coord_flip() +
  facet_wrap( ~ OverTime) +
  scale_fill_few(palette = 'Dark') +
  theme_few()
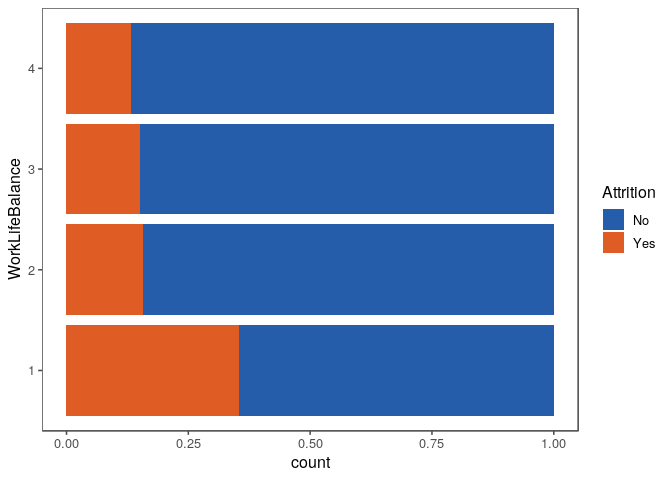
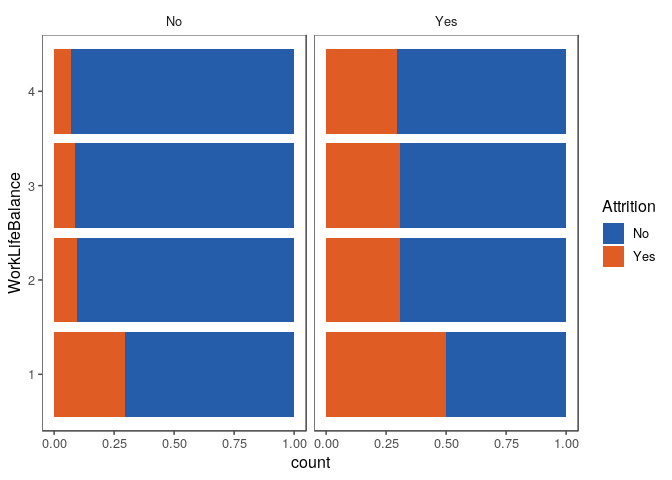
Work-Life Balence
Work-life balence appears to have a high impact on employee attrition.
Nearly 50% with the lowest job involvement leave the position. It is
expected that there would be an interaction with JobRole, JobLevel,
and OverTime.
train %>% ggplot(aes(x = WorkLifeBalance, fill = Attrition)) +
  geom_bar(position = 'fill') +
  coord_flip() +
  scale_fill_few(palette = 'Dark') +
  theme_few()
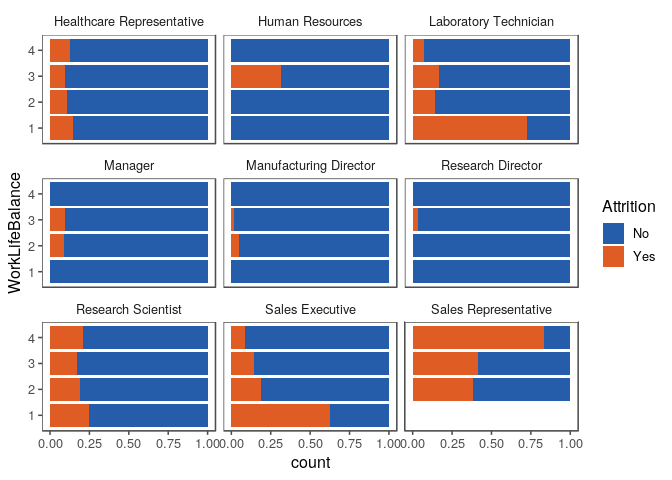
Job Role Interaction
Sales Executives and Laboratory Technitions with low work-life balence have high attrition rates.
train %>% ggplot(aes(x = WorkLifeBalance, fill = Attrition)) +
  geom_bar(position = 'fill') +
  coord_flip() +
  facet_wrap( ~ JobRole) +
  scale_fill_few(palette = 'Dark') +
  theme_few()
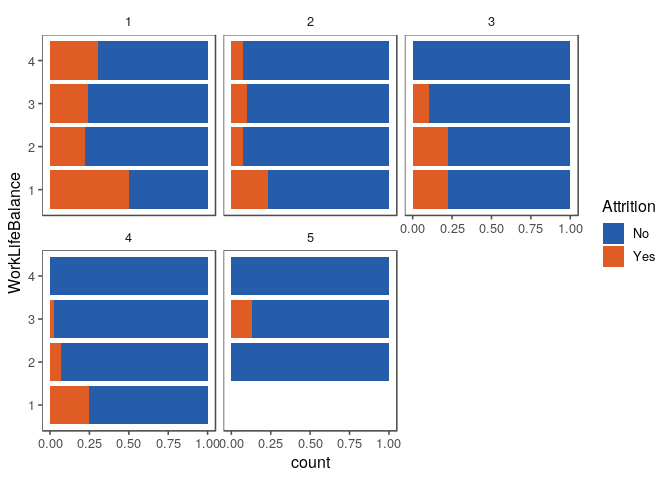
Job Level Interaction
Low work-life balence appears to have an affect on lower job levels, especially level 1.
train %>% ggplot(aes(x = WorkLifeBalance, fill = Attrition)) +
  geom_bar(position = 'fill') +
  coord_flip() +
  facet_wrap( ~ JobLevel) +
  scale_fill_few(palette = 'Dark') +
  theme_few()
Overtime Interaction
Attrition is higher for each level of job involvement, but it is also generally higher for Overtime workers.
train %>% ggplot(aes(x = WorkLifeBalance, fill = Attrition)) +
  geom_bar(position = 'fill') +
  coord_flip() +
  facet_wrap( ~ OverTime) +
  scale_fill_few(palette = 'Dark') +
  theme_few()
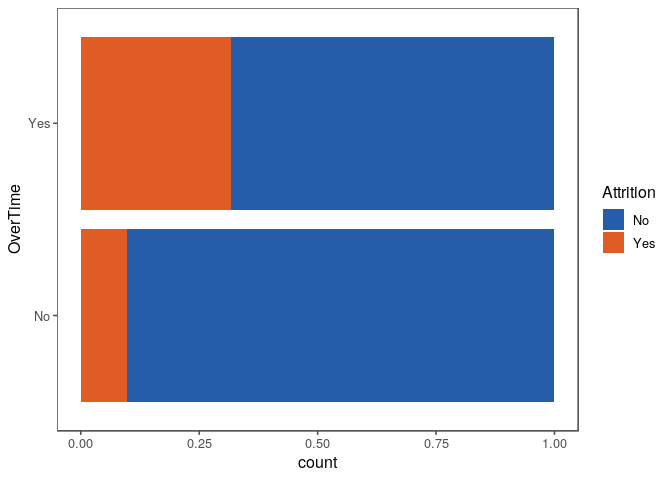
Overtime
Job involvement appears to have a high impact on employee attrition.
Nearly 50% with the lowest job involvement leave the position. It is
expected that there would be an interaction with JobRole, JobLevel,
and MonthlyIncome.
train %>% ggplot(aes(x = OverTime, fill = Attrition)) +
  geom_bar(position = 'fill') +
  coord_flip() +
  scale_fill_few(palette = 'Dark') +
  theme_few()
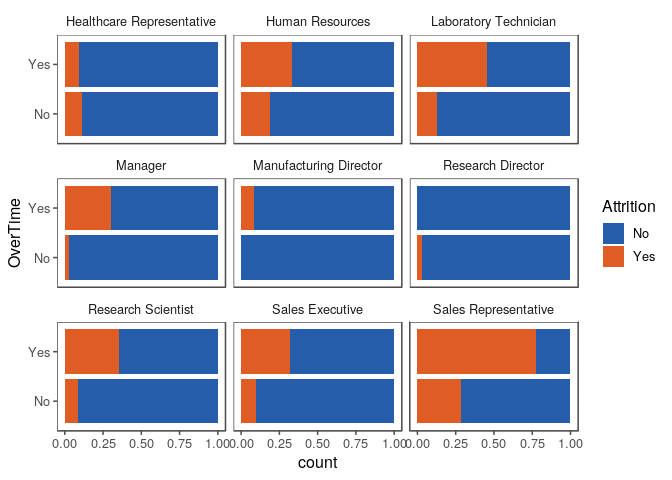
Job Role Interaction
Sales Executives and Laboratory Technitions with low work-life balence have high attrition rates.
train %>% ggplot(aes(x = OverTime, fill = Attrition)) +
  geom_bar(position = 'fill') +
  coord_flip() +
  facet_wrap( ~ JobRole) +
  scale_fill_few(palette = 'Dark') +
  theme_few()
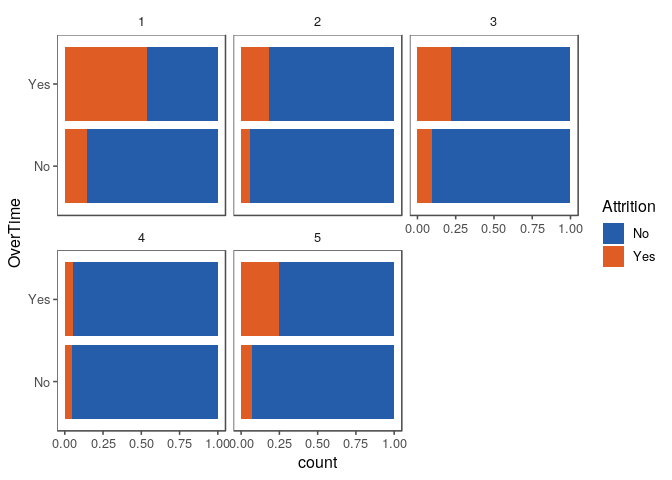
Job Level Interaction
Low work-life balence appears to have an affect on lower job levels, especially level 1.
train %>% ggplot(aes(x = OverTime, fill = Attrition)) +
  geom_bar(position = 'fill') +
  coord_flip() +
  facet_wrap( ~ JobLevel) +
  scale_fill_few(palette = 'Dark') +
  theme_few()
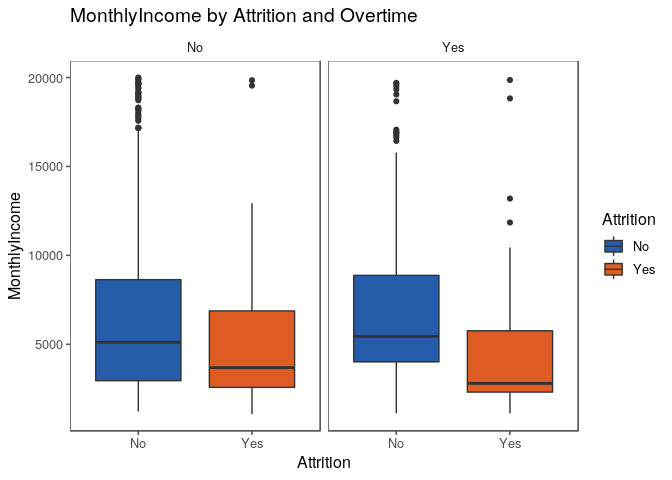
MonthlyIncome Interaction
Monthly income appears to be lower for employees who are working overtime with attrition.
train %>%
  ggplot(aes(x = Attrition,
             y = MonthlyIncome,
             fill = Attrition)) +
  geom_boxplot() +
  facet_wrap(~ OverTime) +
  scale_fill_few(palette = 'Dark') +
  theme_few() +
  ggtitle('MonthlyIncome by Attrition and Overtime')